
A map feels
permanent. Roads have lines, rivers have boundaries, bridges connect two sides,
and infrastructure sits exactly where the database says it should.
Then a major flood
arrives and suddenly the map is only a record of how the landscape used to be.
That is one of the
striking lessons from Nepal’s recent flood disaster. At the Chilime Hydropower
Project along the Trishuli River, water carrying silt, rock and debris entered
the underground powerhouse and access tunnel. At the same time, damaged roads
and bridges made it extremely difficult for rescue teams and equipment to reach
the site.
The event raises a
simple but important question:
After a flood, how
much of yesterday’s map can we still trust?
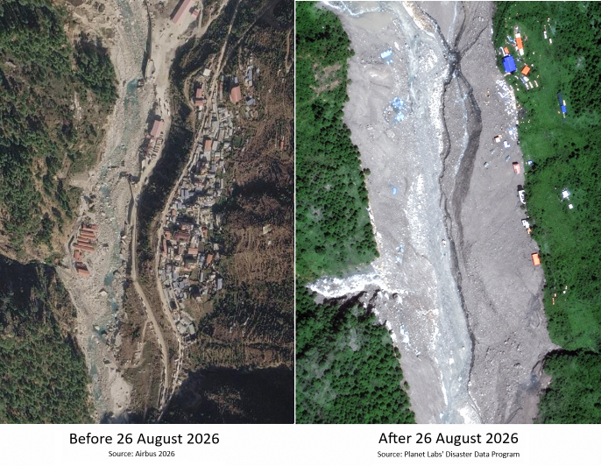
The before-and-after
satellite images tell part of the story immediately.
Before the event,
the river corridor appears relatively defined, with roads, structures and
developed areas clearly visible along its edge. In the post-event image, the
same landscape looks fundamentally different. The river corridor has expanded,
large areas are covered by sediment and debris, and features that once appeared
clearly separated from the river are now within a dramatically altered surface.
This is where Remote
Sensing becomes especially powerful not because it tells us everything, but
because it lets us quickly see where the landscape has changed.
A road may still
appear in an existing GIS database even though part of it has disappeared. A
bridge may still be standing, but its approach may no longer be usable. A
riverbank may have shifted. Sediment may have buried previously accessible
land. An infrastructure site that was once connected to the road network may
suddenly become isolated.
At Chilime, that
isolation became one of the defining challenges of the response. The hydropower
management described the situation simply:
“We are isolated on all sides.”
That statement is
not only about rescue logistics. It is also a spatial problem.
A flood does not
need to destroy an entire road network to create major disruption. Sometimes
one failed bridge, one washed-out road section, or one blocked access point can
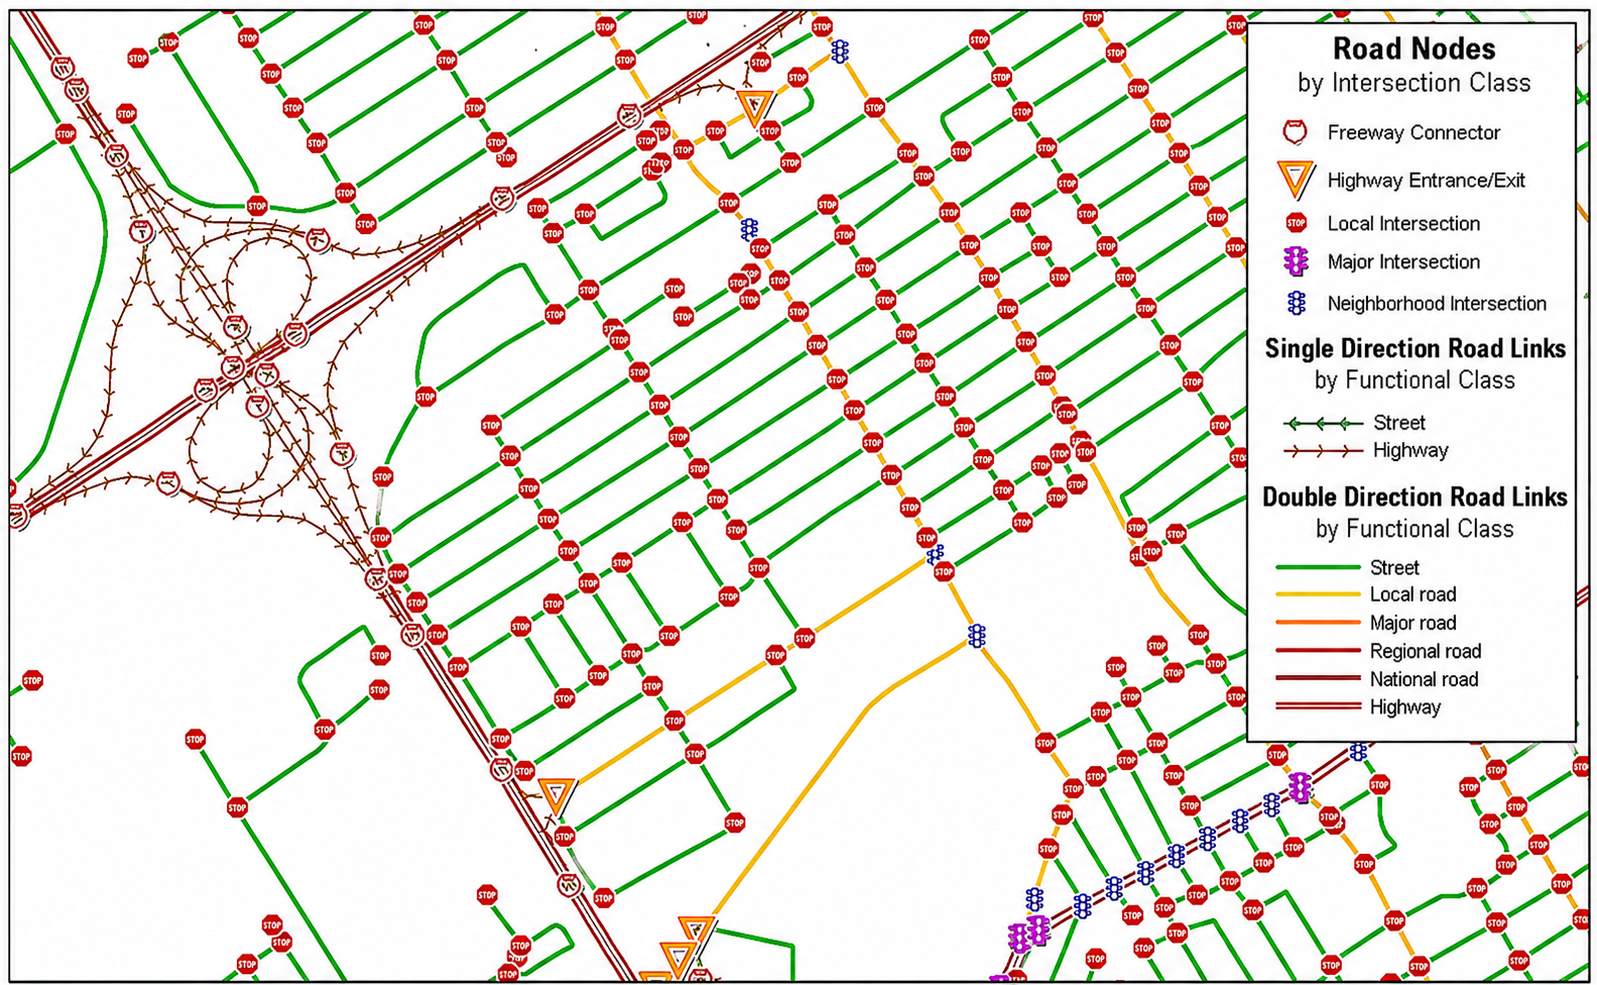
disconnect an entire facility or community. GIS-based network analysis can help
identify these breaks, possible alternative routes, and which connections
should be restored first.
This is why
post-flood GIS should go beyond drawing the extent of inundation.
The more useful
questions are often:
What moved? What
disappeared? What became disconnected? What is now closer to the river than
before? And where should field teams investigate first?
Remote Sensing may indicate that a riverbank has shifted or
a road has been disrupted, but it cannot always tell us whether a structure is
safe, how much elevation has changed, or whether a slope remains stable. That
is where different geospatial tools begin to work together. Satellite imagery
can rapidly screen the affected landscape. GIS can relate those changes to
roads, settlements, bridges and infrastructure.
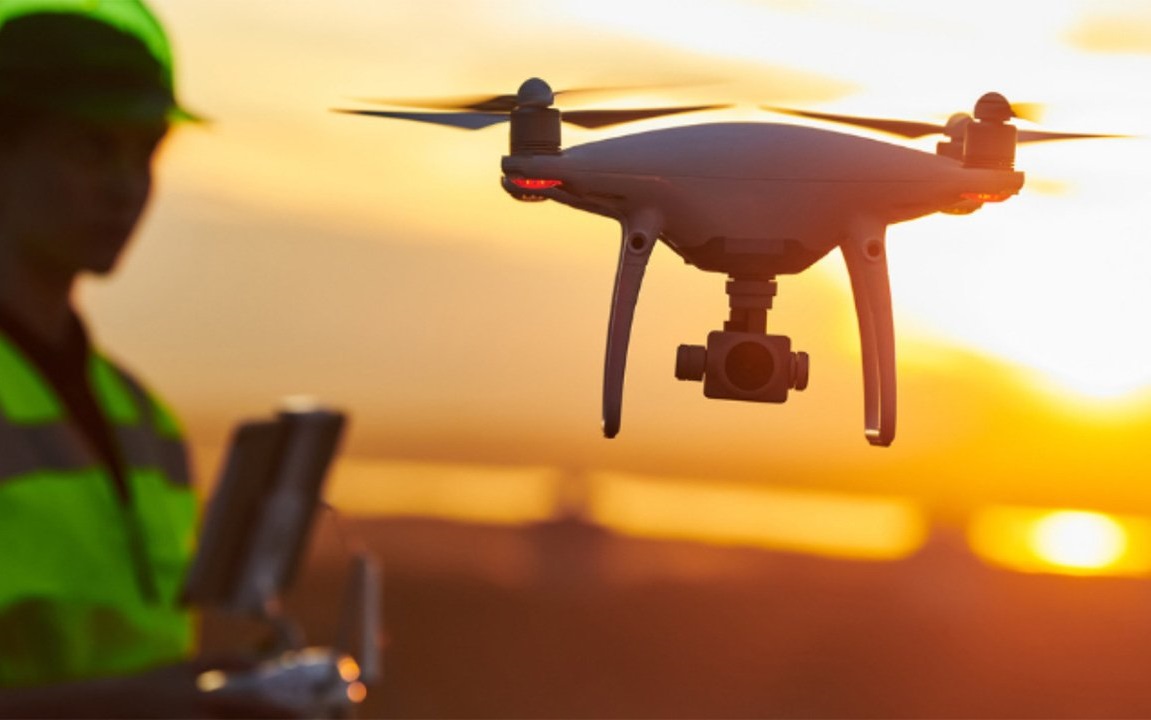
Drone photogrammetry can provide detailed orthophotos and 3D surface models.
RTK-GNSS, Total Station and digital surveying can then measure the precise
geometry and elevation needed for engineering assessment.
The real question
comes next:
Should everything
simply be rebuilt exactly where it was?
If the river has
shifted, if a slope has become unstable, or if an access corridor has
repeatedly failed, reconstruction may need to do more than restore the previous
condition.
A road may need
realignment. A bridge approach may need redesign. A riverbank may require
protection. Critical infrastructure may need a more resilient access route.
Some locations may even need to be reconsidered entirely.
This is where GIS
moves from documenting damage to supporting better decisions. By combining the
changed landscape with information on roads, settlements, infrastructure and
terrain, GIS can help identify where rebuilding is suitable, where redesign may
be needed, and which locations should be prioritized first.
Nepal’s mountainous
terrain is very different from Bangladesh’s low-lying deltaic landscape, but
the lesson is relevant to both: after a major flood, the most useful map may
not be the one showing where the water reached. It may be the map showing what
the water changed. The real value of post-disaster GIS is not simply recording
where the flood occurred. It is helping us understand the new landscape that
planners, engineers and communities must live with and plan for next.
Share this page via
More from Farah Shamima Sultana